Turn Data Into Decisions
BI dashboards, data pipelines, and predictive models that show you exactly what's happening — and what's next.
From Raw Data to Confident Decisions
Naxfront Analytics is the division that turns data into decisions. From our base in Abuja, Nigeria, we help startups, enterprises, and global brands stop guessing and start knowing. Most businesses are already sitting on a goldmine of data — sales, inventory, customer behaviour, payments — and using almost none of it. We build the dashboards, pipelines, and predictive models that surface what's really happening in your business and, just as importantly, what's coming next.
Our work covers the full analytics stack: business intelligence dashboards tailored to your exact KPIs, ETL pipelines that pull from POS systems, databases, spreadsheets, CRMs, and payment gateways into one central warehouse, predictive analytics that forecast demand and risk, and automated reporting that lands in the right inboxes without anyone touching a spreadsheet. We design for the decisions you actually make every day — with the charts, filters, alerts, and segmentation that matter to your team.
Under the hood, our engineers work with Python, Apache Spark, PostgreSQL, Tableau, Power BI, Recharts, FastAPI, and AWS. We connect to the tools you already use, build a single source of truth, and make sure the numbers you see are accurate and current. Whether you need a focused dashboard for one team or a full enterprise data warehouse with forecasting, we build it to be reliable, fast, and genuinely useful — not a dashboard nobody opens twice.
Businesses across Nigeria and around the world choose Naxfront Analytics because we get a first working dashboard in front of you quickly, then expand coverage as the value becomes obvious. You work directly with senior data engineers and analysts who care about clarity as much as correctness. From raw, messy data to confident, defensible decisions, we build the analytics layer your business has been missing. If you're ready to turn your data into your sharpest advantage, Naxfront Analytics is the team to build it.
What We Build
Seven ways we help you see clearly, decide faster, and act with confidence.
BI Dashboards
Real-time dashboards tailored to your KPIs, so the whole team sees what's happening at a glance.
Data Pipelines & ETL
Reliable pipelines that pull from every source into one clean, central warehouse you can trust.
Predictive Analytics
Forecasting and modelling that turn 'we think' into 'we know' — and help you act before competitors do.
Data Visualization
Clear, beautiful charts that make complex data instantly understandable for any audience.
Business Intelligence
A single source of truth that connects sales, operations, and customers into decisions you can defend.
Reporting Automation
Scheduled, automated reports delivered to the right people — no more manual spreadsheet wrangling.
Customer Segmentation
Understand exactly who your customers are and what they need, then target with precision.
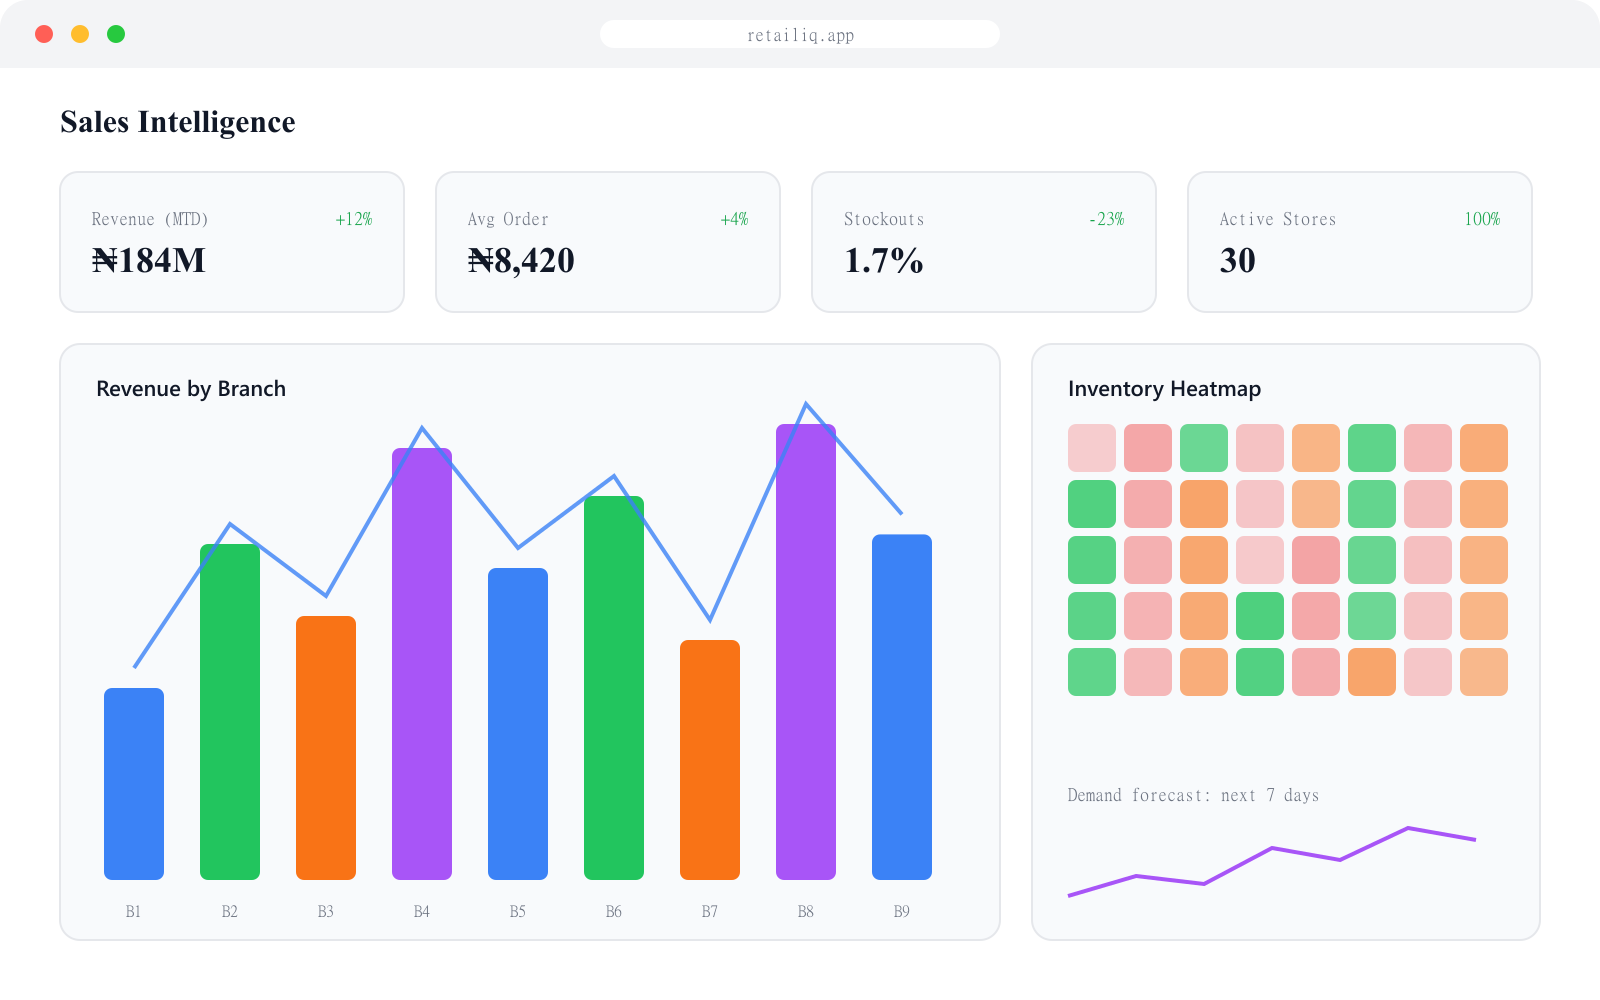
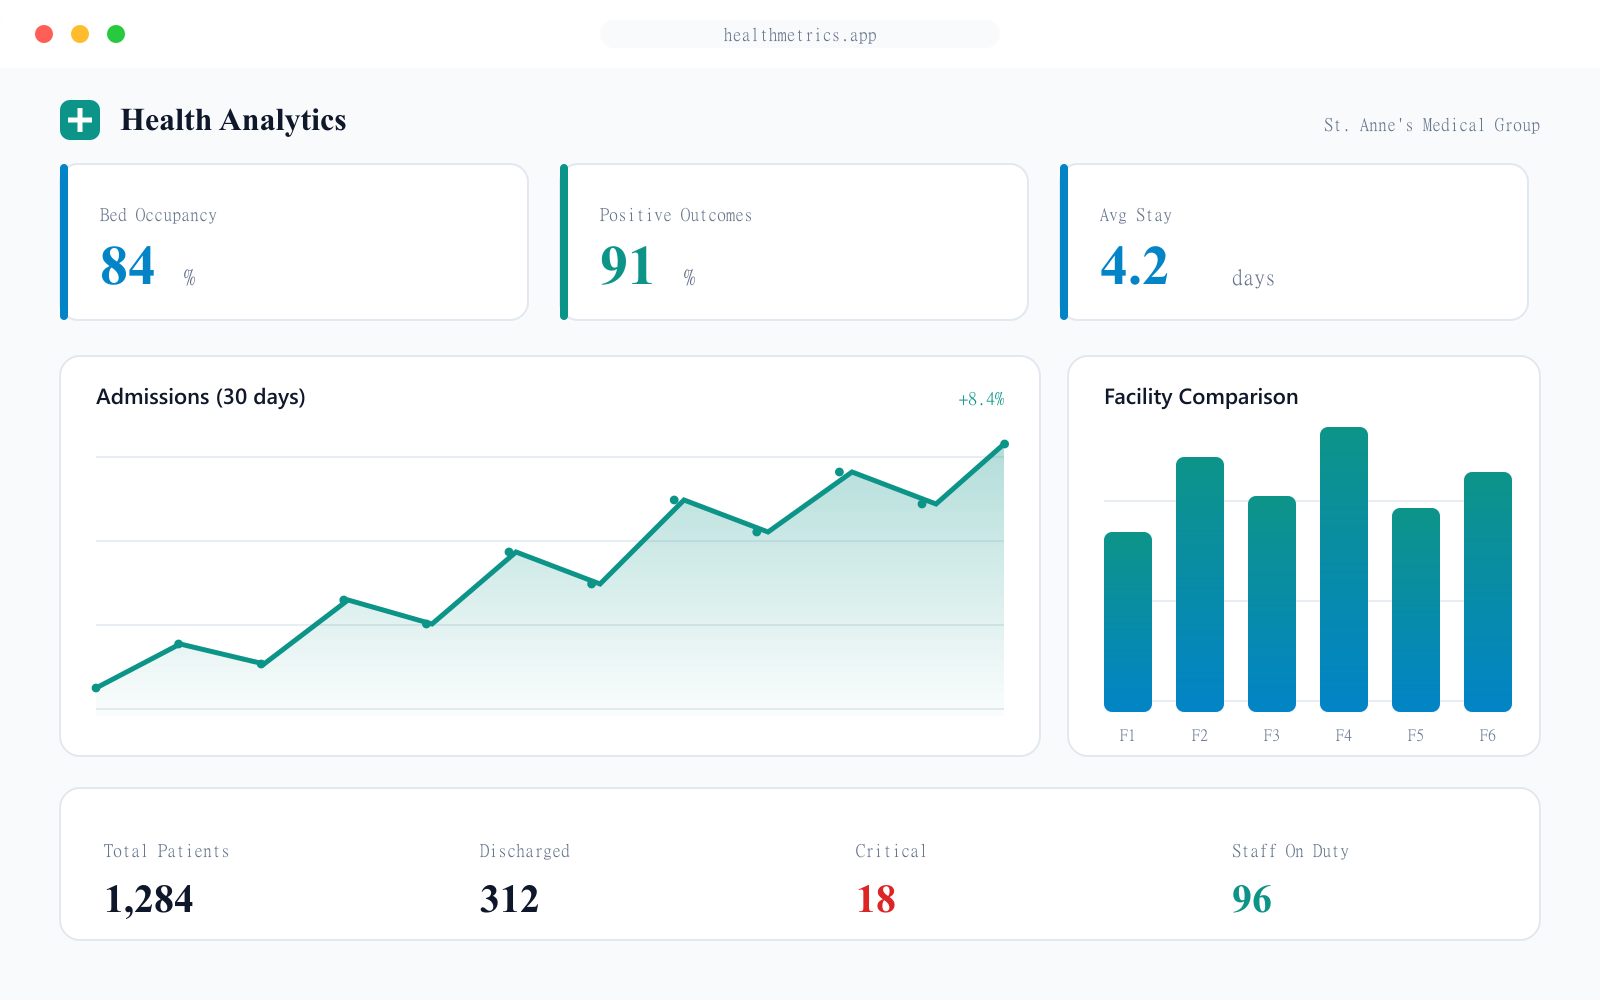
See It In Action
A live, interactive sample of the kind of dashboard we build — powered by real charting, not screenshots.
Sample Analytics Dashboard
Realistic data, rendered live with Recharts
Revenue (₦M)
Visitors vs Orders
Revenue by Segment
Our Stack
Frequently Asked Questions
Business intelligence (BI) turns the raw data your business already generates — sales, inventory, customers — into clear dashboards and reports that show what's happening and why. If you're making decisions on gut feel or week-old spreadsheets, you need it. BI lets you see problems and opportunities in real time.